TL;DR
An ecommerce KPI, or key performance indicator, is a number that tells you whether the store is actually healthy, not just busy. The trap is that stores track dozens of metrics and mistake the impressive-looking ones for the important ones.
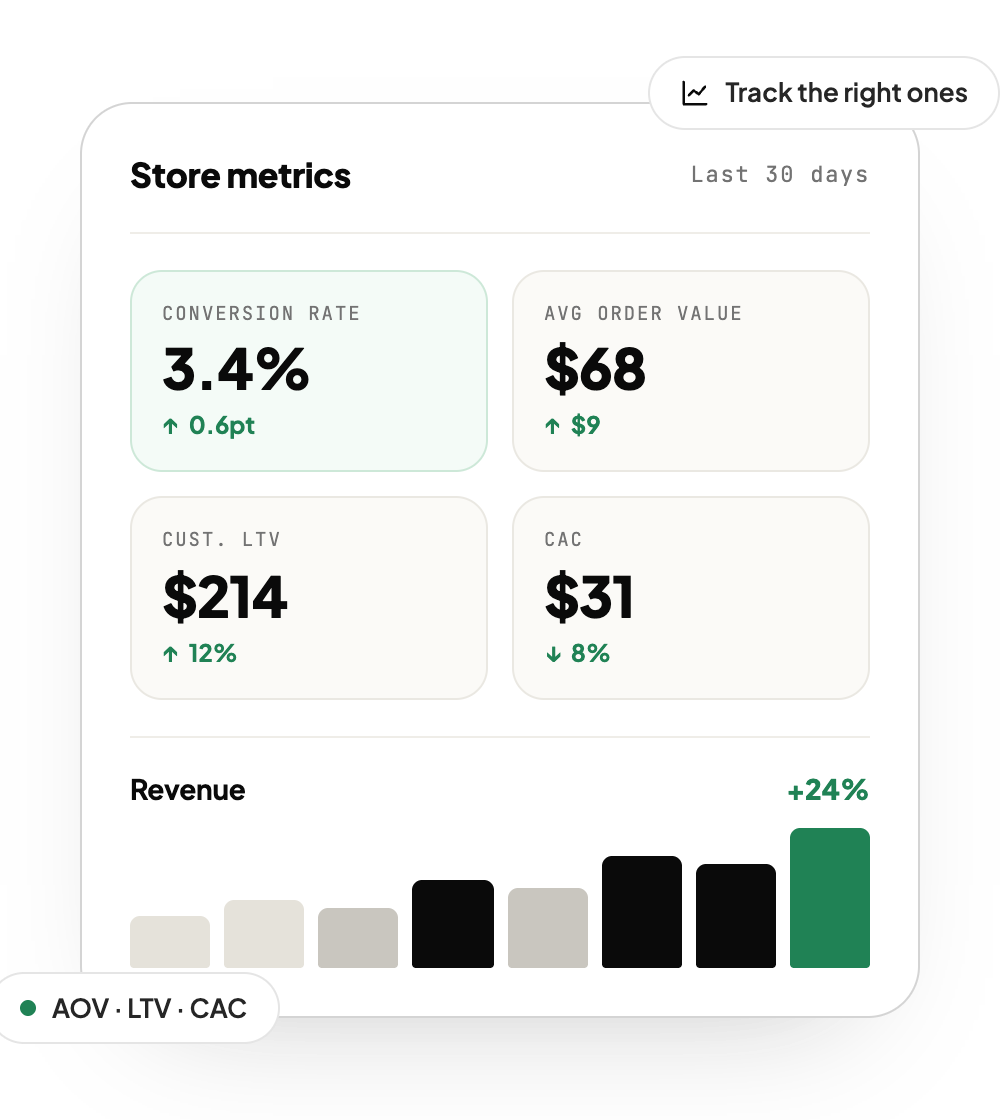
A small set of KPIs genuinely runs an ecommerce business, and they fall into four groups. Acquisition: what it costs to get a customer, mainly customer acquisition cost. Conversion: what share of visitors buy, and where they drop off. Order and revenue: average order value and the returns that quietly eat it. Retention: repeat purchase rate and lifetime value, which is where most of the profit actually lives.
The single most useful idea is that these numbers only mean something in relation to each other. Acquisition cost is meaningless without lifetime value to compare it to. A rising conversion rate is bad news if acquisition cost rose faster. Traffic and social followers, the metrics stores love to celebrate, tell you almost nothing on their own. This guide covers the KPIs that matter, how they connect, the vanity metrics to stop worshipping, and how to read a benchmark honestly rather than being flattered or scared by it.
What an Ecommerce KPI Actually Is
A KPI is a metric you have chosen to treat as a signal of performance, meaning it is tied to a goal you care about. That last part is what separates a KPI from a mere metric. A store can measure hundreds of things; a KPI is one of the few you actually steer by.
The distinction matters because most ecommerce dashboards are cluttered with metrics that are easy to collect and pleasant to look at but do not inform any decision. Total pageviews, social media followers, and email list size all go up and to the right and feel like progress, yet none of them tells you whether the business is making money or losing it. A real KPI, by contrast, changes what you do: if it moves the wrong way, you act.
A useful KPI has three traits. It is tied to money or the path to money, so it reflects business health rather than activity. It is actionable, meaning you can do something specific when it moves. And it is comparable over time, so a change actually means something. Measured that way, the list of KPIs that matter is far shorter than the list of metrics most stores track, which is good news, because a focused set of the right numbers beats a sprawling dashboard of the wrong ones. The rest of this guide is about which numbers earn a place on that short list.
The Metrics That Actually Matter
Before the detail, here is the short list, grouped by the question each one answers. If you tracked only these, you would understand your store better than most operators drowning in dashboards.
- Customer acquisition cost (CAC): what it costs to get one new customer.
- Conversion rate: the share of visitors who buy.
- Cart and checkout abandonment: where buyers drop off at the end.
- Average order value (AOV): how much a customer spends per order.
- Return rate: how much of that revenue comes back.
- Repeat purchase rate: how many customers come back to buy again.
- Customer lifetime value (LTV): the total gross profit a customer generates over time.
- The LTV to CAC ratio: whether the whole model makes money.
That is eight numbers, in four groups, acquisition, conversion, order and revenue, and retention. The sections that follow take each group in turn, with honest benchmarks where reliable ones exist. The reason to keep the list this tight is that these eight, read together, answer the only questions that matter: are you acquiring customers profitably, converting the traffic you get, earning enough per order, and keeping customers long enough to make it all worthwhile.
Acquisition KPIs
Acquisition KPIs tell you what growth costs, and in 2026 that cost is the pressure point for most stores.
Customer acquisition cost (CAC) is the total you spend on sales and marketing to acquire customers, divided by the number of new customers acquired. It is the foundational acquisition number because it sets the price of growth, and that price keeps rising. Meta's own filings show the average price per ad rose 12 percent year over year in 2026, which means a store's CAC climbs even when it changes nothing. A CAC that looks fine today can quietly become unaffordable as ad costs inflate, so it needs watching over time, not once.
The critical thing about CAC is that it is meaningless in isolation. A CAC of fifty dollars is excellent if a customer is worth five hundred over their lifetime and ruinous if they are worth forty. This is why CAC must always be read against lifetime value, which is covered below. A store that celebrates a low CAC without knowing its LTV is admiring half an equation.
A related acquisition signal is return on ad spend (ROAS), the revenue earned per dollar of ad spend, and specifically the break-even ROAS set by your margin, the floor below which an ad-driven sale loses money. ROAS and CAC are two views of the same question, whether you are acquiring customers profitably, and neither is complete without the retention numbers to tell you what the acquired customer is actually worth.
Conversion KPIs
Conversion KPIs measure how well you turn the traffic you paid for into sales, and this is where a lot of quiet revenue leaks away.
Conversion rate is the share of visitors who complete a purchase, and it is the headline conversion KPI. The honest benchmark is sobering: the average Shopify store converts at about 1.4 percent, with roughly 3.2 percent placing a store in the top 20 percent. That benchmark is a few years old and should be read as directional, but the shape holds, most visitors do not buy, so small improvements in conversion rate translate into meaningful revenue without any extra traffic spend.
Cart and checkout abandonment is the conversion KPI that pinpoints where the drop-off happens. Baymard Institute's documented average cart abandonment rate is about 70 percent, an average across many studies rather than a single measurement, but a reliable reminder that the majority of shoppers who start a purchase do not finish it. Tracking where they abandon, browsing, cart, or the checkout itself, tells you which fix will pay back most, and abandonment is often a cheaper thing to improve than buying more traffic to replace the lost sales.
The reason conversion KPIs matter so much is leverage. Because you have already paid to bring the visitor in, every point of conversion rate you recover is nearly pure gain, whereas every new visitor costs more acquisition spend. A store obsessing over traffic while ignoring its conversion rate is filling a leaky bucket, which is exactly why these KPIs sit at the center of the funnel rather than the top.
Order and Revenue KPIs
Order and revenue KPIs measure how much each transaction is actually worth to you, net of what comes back.
Average order value (AOV) is total revenue divided by number of orders, and it is one of the most direct levers a store has, because raising it costs no additional acquisition. A higher AOV, earned through relevant product recommendations, bundles, or a sensible free-shipping threshold, improves the economics of every order and widens the gap between what a customer is worth and what they cost to acquire. It is worth tracking closely precisely because it is so movable.
Return rate is the KPI stores most often leave off the dashboard, and it quietly erodes everything else. The National Retail Federation estimates that returns run meaningfully higher for online orders than for stores overall, and a returned order is not just lost revenue, it is the acquisition and shipping cost spent to win a sale that reversed. A store measuring gross revenue while ignoring returns is overstating its real performance, sometimes badly, which is why net revenue after returns is the number that actually counts.
Together, AOV and return rate define the true value of an order. Gross AOV flatters you; AOV net of returns tells the truth. A store can lift its headline AOV with aggressive bundling and then watch the return rate climb, ending up no better off, so these two KPIs have to be read as a pair rather than in isolation.
Retention KPIs
Retention KPIs are where the profit hides, and they are the ones stores measure least and should measure most.
Repeat purchase rate is the share of customers who buy again, and it is the clearest single signal of whether a store has a business or just a series of one-time transactions. It is also directly actionable: it responds to the post-purchase experience, the product quality, and the follow-up. A store with a healthy repeat rate can afford to acquire customers that a one-time-purchase store could never justify, because each customer is worth several orders rather than one.
Customer lifetime value (LTV) is the total gross profit a customer generates across their whole relationship with you, and it is the number that gives every other KPI meaning. LTV is what CAC is measured against, what justifies acquisition spend, and what turns retention from a soft idea into a hard number. It is best read off your real repeat behavior rather than a hopeful projection, the way a store like FIGS can point to net revenue per active customer well above its average order value as evidence that customers genuinely come back.
The KPI that ties acquisition and retention together is the LTV to CAC ratio, the value of a customer divided by the cost to acquire them. This single ratio answers the question the whole business rests on: does acquiring a customer make money over time? A ratio comfortably above one means the model works and can scale; a ratio near or below one means the store is buying revenue at a loss, no matter how good the individual metrics look. If you track one composite KPI, this is the one, because it forces acquisition and retention to be judged together rather than separately.
How the KPIs Connect
The reason a dashboard of isolated numbers misleads is that these KPIs only mean something in relation to each other. They form a chain, and a change in one ripples through the rest.
Trace the chain. You spend to acquire a visitor, which sets your CAC. Your conversion rate and abandonment determine how many of those visitors become buyers. AOV minus return rate sets what each order is actually worth. Repeat purchase rate turns one order into several, which builds LTV. And LTV against CAC tells you whether the whole loop makes money. Every KPI is a link; the business is the chain.
This is why reading any single KPI in isolation is dangerous. A rising conversion rate looks like a win until you notice CAC rose faster because you bought worse traffic. A high AOV looks great until returns are netted out. A low CAC looks efficient until you see the LTV is even lower. The numbers that look good alone can hide a business that is quietly losing money, and the numbers that look mediocre alone can belong to a business that is thriving, because the relationships between them are what determine health.
The practical consequence is that you should never celebrate or panic over one KPI without checking the ones it connects to. When a metric moves, the useful question is not "is this number good?" but "what did it do to the chain?" A store that internalizes this stops chasing individual metrics and starts managing the system, which is the difference between busy and profitable.
The Vanity Metrics That Mislead
Some of the most-watched ecommerce numbers are vanity metrics: they rise reliably, feel like progress, and inform almost no decision. Naming them is as useful as naming the real KPIs, because the attention they steal is attention not paid to what matters.
Total traffic and pageviews. More visitors feel like growth, but traffic without conversion is just cost. A store can double its traffic and make less money if the new visitors convert worse or cost more to acquire. Traffic is an input, not a result, and celebrating it in isolation is the classic vanity trap.
Social media followers and likes. A large following looks like brand strength, but followers are not customers, and engagement rarely maps to revenue. Unless a social audience demonstrably converts, the follower count is a number that flatters without informing.
Email list size. A big list feels valuable, but a list full of unengaged or bought addresses hurts more than it helps, because it drags down deliverability and inflates costs. The KPI that matters is not list size but what the list actually earns, which is why engaged subscribers and revenue per email beat raw subscriber counts every time.
Gross revenue without context. Even revenue can be a vanity metric when it is read alone. Revenue that costs more to generate than it returns is not success, and a store growing its top line while its LTV-to-CAC ratio slips below one is growing itself broke. Revenue matters, but only alongside the cost and retention numbers that show whether it is profitable.
The common thread is that vanity metrics measure activity, while real KPIs measure outcomes. Activity is easy to grow and satisfying to watch, which is exactly why it is dangerous: it lets a store feel successful while the numbers that decide survival go unwatched. The discipline is to demand of every metric on the dashboard, does this change a decision, and to demote the ones that do not.
How to Read a Benchmark Without Fooling Yourself
Benchmarks, the "average conversion rate is X" figures, are useful and widely misused, so it is worth being honest about how to read them.
First, most benchmarks are averages that hide huge variation. A single "average conversion rate" spans tiny boutiques and giant retailers, cheap impulse buys and expensive considered purchases, and your store may legitimately sit far from the average for good reasons. A benchmark is a rough orientation, not a target you are failing to hit, and treating it as a target leads to chasing a number that was never meant for your situation.
Second, check the date and the source. Many circulating benchmarks are years old or come from vendors with an interest in the answer, and a stale or self-interested figure can mislead more than no figure at all. The honest ones state their sample size, their methodology, and their date, and a benchmark without those is worth little. The Shopify conversion figure cited earlier, for instance, is worth using only with its 2023 vintage stated plainly.
Third, your own trend beats any external benchmark. The most useful comparison is not you against the industry, it is you against yourself last month. Your conversion rate rising from your own baseline is unambiguous progress; your conversion rate sitting below some blended industry average may mean nothing at all. External benchmarks are for rough context; your own trend line is for decisions.
Used this way, benchmarks orient without dictating. The mistake is to let a benchmark either flatter you into complacency or scare you into chasing a number that does not fit your business, when the number that actually matters is whether your own KPIs are moving the right way over time.
Common Mistakes With Ecommerce KPIs
- Tracking too many metrics. A sprawling dashboard buries the few numbers that matter under dozens that do not. A focused set of real KPIs beats a wall of vanity metrics.
- Reading KPIs in isolation. A single number can flatter or frighten without the ones it connects to. Always read a KPI against its neighbors in the chain.
- Celebrating vanity metrics. Traffic, followers, and list size feel like progress but rarely inform a decision. Demand that every metric change what you do.
- Ignoring returns. Gross revenue and gross AOV overstate performance. Net them against returns to see the truth.
- Measuring acquisition without retention. CAC and ROAS are meaningless without LTV. The LTV-to-CAC ratio is the number that tells you if the model works.
- Chasing benchmarks instead of your own trend. External averages hide variation and go stale. Your own month-over-month movement is the comparison that matters.
A Simple KPI Dashboard to Start With
If you are building a KPI dashboard, resist the urge to track everything. Start with a small, honest set and add only when a new number would change a decision.
Track these eight, and read them together: customer acquisition cost, conversion rate, cart and checkout abandonment, average order value, return rate, repeat purchase rate, customer lifetime value, and the LTV-to-CAC ratio. These cover acquisition, conversion, order value, and retention, which is the whole business.
Watch each against your own trend, month over month, rather than against a blended industry average, so a change actually means something for your store.
Net out the flattering numbers. Use AOV after returns and revenue after returns, so the dashboard tells the truth rather than the nicest version of it.
Lead with the LTV-to-CAC ratio. If you elevate one composite number to the top of the dashboard, make it this, because it forces every other KPI to be judged as part of a system that either makes money or does not.
Ignore the vanity metrics on purpose. Keep traffic, followers, and list size off the KPI dashboard, or clearly labeled as context, so they do not steal attention from the numbers that decide the business.
Most stores start with too many metrics and the wrong ones. Start with these eight, read them as a connected system, and you will understand your store better than a competitor buried in a hundred-metric dashboard.
FAQ
What are the most important ecommerce KPIs?
The ones tied to money: customer acquisition cost, conversion rate, cart and checkout abandonment, average order value, return rate, repeat purchase rate, customer lifetime value, and the LTV-to-CAC ratio. Together they cover acquisition, conversion, order value, and retention, which is the whole business.
What is a good ecommerce conversion rate?
There is no universal good number, but the average Shopify store converts at roughly 1.4 percent, with about 3.2 percent placing a store in the top 20 percent, per a 2023 benchmark. Treat that as rough orientation rather than a target, since conversion varies widely by product, price, and traffic source. Your own trend matters more than the average.
What is the difference between a metric and a KPI?
A metric is anything you can measure; a KPI is a metric you have chosen to steer by because it is tied to a goal. Every KPI is a metric, but most metrics are not KPIs. The test is whether the number changes a decision when it moves.
What are vanity metrics in ecommerce?
Numbers that rise reliably and feel like progress but rarely inform a decision, such as total traffic, social media followers, email list size, and gross revenue read without cost context. They measure activity rather than outcomes, and they distract from the KPIs that decide whether the store makes money.
Why is the LTV-to-CAC ratio so important?
Because it answers the question the whole business rests on: does acquiring a customer make money over time. It forces acquisition cost and lifetime value to be judged together, so a low CAC or a high AOV cannot hide a model that loses money. A ratio comfortably above one means the business can scale profitably.
How should I use ecommerce benchmarks?
As rough context, not targets. Most benchmarks are averages that hide huge variation, and many are stale or come from interested sources, so check the date and methodology. The most useful comparison is your own performance month over month, because your trend is unambiguous where an industry average may not apply to you at all.
Where to Go From Here
The point of ecommerce KPIs is not to measure more, it is to measure the few numbers that actually decide whether the store makes money, and to read them as a connected system rather than a wall of isolated stats. Track the eight that matter, net out the flattering ones, lead with the LTV-to-CAC ratio, and ignore the vanity metrics on purpose. Several of these KPIs, conversion, abandonment, repeat purchase, are moved by what happens after a shopper reaches out or nearly buys, and for that side, Kovax handles voice, WhatsApp, and cart recovery for Shopify stores so fewer of those measured moments end in a loss.